

Outlier Analysis
This page contains the following sections:
- Overview of Outliers
- Outlier Analysis Dialog
- Example of Outliers
- Accessing Series Statistics Commands for Outliers
- Focus on Outliers
- Exclude Outliers
Overview of Outliers
The Outlier Analysis dialog allows you to control the display of outlying data elements in a scatter chart. For example, you may want to display outliers in a special color to draw attention to them. Or you may want to view the outliers only, and to look for further breakdowns or trends.
Outlier Analysis Dialog
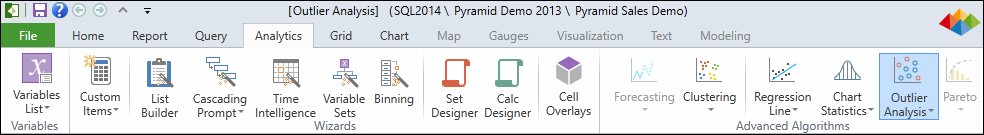
To start the Outlier Analysis dialog, select the Outlier Analysis icon in the Data Discovery/Analytics ribbon.
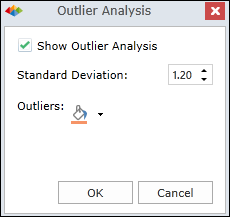
The Outlier Analysis dialog provides two simple configuration parameters, as described below.
Standard Deviation
Enter any number in the 0.00 - 5.00 range to determine the scope of the outlier data. In general, the smaller the standard deviation that you specify, the more outliers will be created.
Outliers Color
Choose a color for the highlighting of outliers.
Example of Outliers
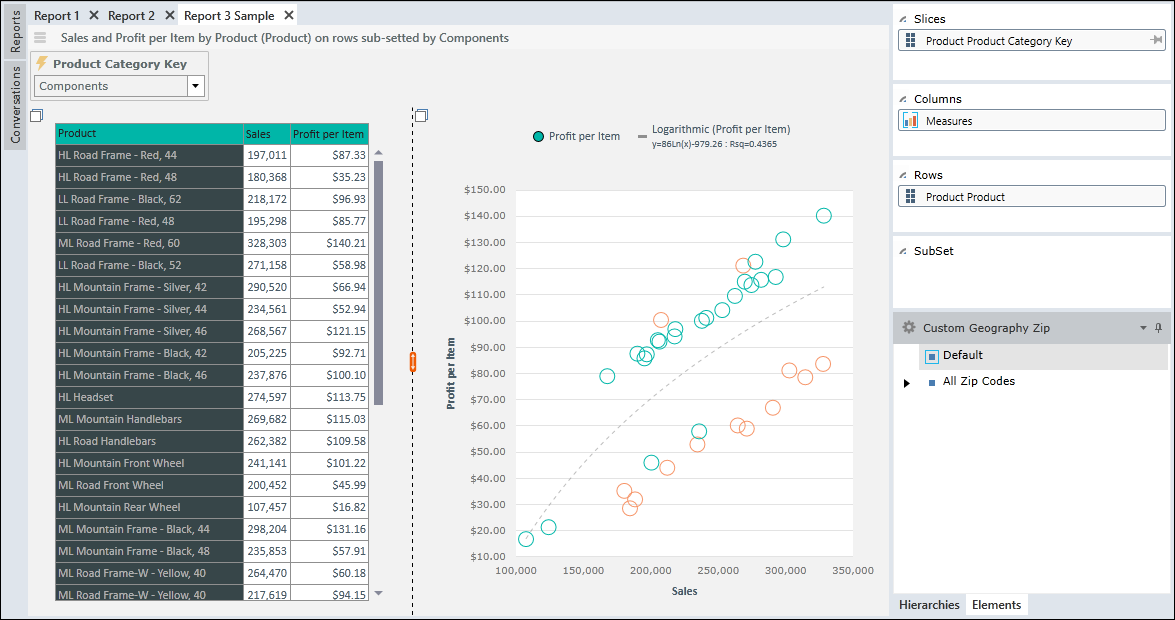
In the example shown below, the outliers are displayed in orange using a standard deviation of 1.20. The "normal data elements" are displayed in green. The scatter chart includes a logarithmic trend line.
Accessing Series Statistics Commands for Outliers
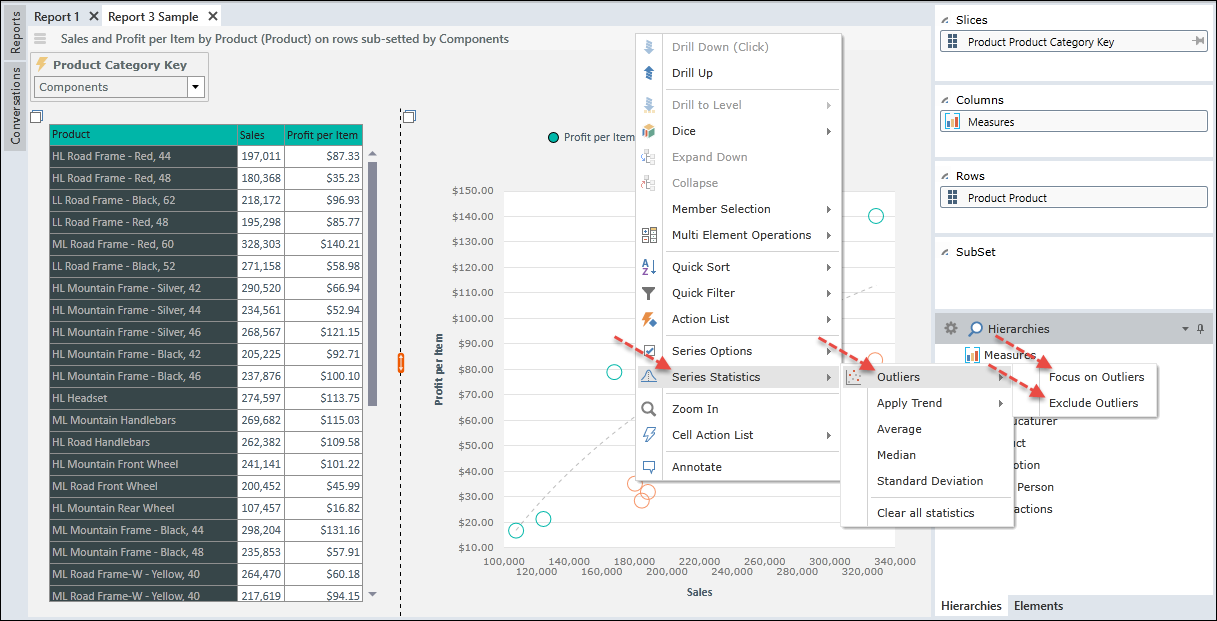
Two additional outlier commands can be accessed under Series Statistics as follows:
- Right click on any element in the scatter chart.
- Choose "Series Statistics".
- Choose "Outliers".
- Choose one of the commands:
Focus on Outliers
To focus on progressively smaller groups of outliers, use the Focus on Outliers command. Each time you issue this command, the current group of outliers becomes the entire plotted data set which is redivided into normal data elements and outliers.
For example, assume we have a total of 100 data elements, of which 80 are normal data elements and 20 are outliers. Applying the Focus on Outliers command will take the 20 outliers and replot them. Let's assume that in the new plotting there are 15 normal data elements and 5 outliers. Clicking on Focus on Outliers again will take the 5 outliers and replot them.
You may reissue the Focus on Outliers command as many times as desired. To return, use the BACK command in the main banner.
Exclude Outliers
To focus on progressively narrower groups of normal data elements, use the Exclude Outliers command. Each time you issue this command, the current group of outliers is excluded. The remaining data elements become the entire plotted data set which is redivided into normal data elements and outliers
For example, assume we have a total of 500 data elements, of which 400 are normal data elements and 100 are outliers. Applying the Exclude Outliers command will exclude the 100 outliers and replot the remaining 400 data elements. Let's assume that in the new plotting, 350 are normal data elements are 50 are outliers. Clicking on Exclude Outliers again will exclude the 50 outliers and replot the remaining 350.
You may reissue the Exclude Outliers command as many times as desired. To return, use the BACK command in the main banner.
Home |
Table of Contents |
Index |
User Community
Pyramid Analytics © 2011-2022